


Excel: the hidden analytical power behind 54 free templates
Article Summary
📖 9 min readThis article reveals how Excel transcends its role as a simple spreadsheet to become a powerful data laboratory, indispensable for projects requiring deep analytical work. It highlights 54 free templates that unlock this hidden power, challenging the limitations of conventional project management software.
Key Points:
- Excel excels as an analytical engine for complex projects, where modern task managers hit their structural limits.
- Projects requiring interdependent variables or complex financial models find unmatched depth in Excel — impossible to replicate in generic SaaS tools.
- The 54 free templates instantly unlock advanced project intelligence capabilities at zero additional cost.
- R&D, finance, and consulting teams continue deepening their use of Excel for its unique ability to handle analytical complexity.
When the spreadsheet becomes a project intelligence tool
54 templates. Free. In software you already have installed.
While everyone debates Notion vs Asana vs Monday, Excel quietly keeps running projects these tools simply cannot handle. Not because Excel is “old.” Because it is fundamentally different — it’s an analytical engine, not a task manager dressed up in a colorful dashboard.
The real question isn’t “Excel or a project management tool?”. It’s: which projects require an analytical depth that no generic SaaS can offer?
Here’s where it gets interesting.
What project management software will never tell you
Modern project management tools are optimized for visual collaboration and ease of use. That’s their strength. It’s also their structural limitation.
When your project involves interdependent variables, complex financial models, or custom data analyses, you quickly hit the glass ceiling of these platforms. You can’t build a conditional formula with 15 levels of nesting in Trello. You can’t run a regression analysis in ClickUp.
What nobody tells you: teams managing projects with high analytical complexity — construction, finance, R&D, strategic consulting — never abandoned Excel. They went deeper.
“Excel is not a project management tool. It’s a language. And like any language, its power depends on the person using it.” — A senior consultant I met on a digital transformation engagement who seemed to be doing just fine.

The 54 Excel templates: a catalog of real business use cases
Microsoft doesn’t distribute 54 templates at random. Each template addresses a genuine business need — often too specific to be covered by a generalist tool.
Let’s flip the perspective: instead of seeing these templates as “starting points,” think of them as a taxonomy of analytical needs that teams actually face in the field.
Project financial tracking
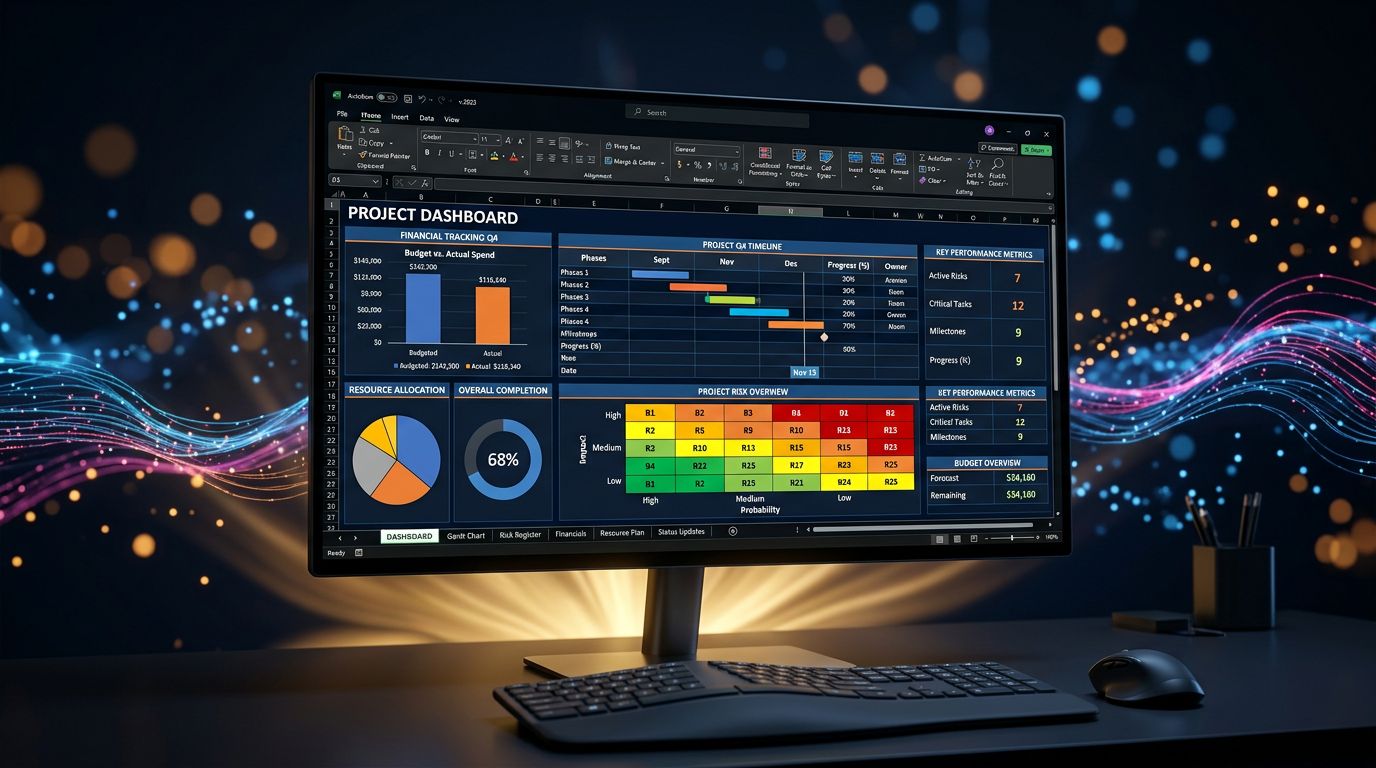
Excel project budget templates go far beyond a simple expense list. You can integrate budget progress curves, automatic variance calculations, and estimate-at-completion (EAC) projections based on the cost performance index (CPI). A project management tool gives you a “budget” widget. Excel gives you a financial model.
Risk analysis
Risk management on a complex project isn’t a checklist. It’s a probability × impact matrix with weighted scores, Monte Carlo curves if you go further, and trigger indicators. Excel natively supports this level of sophistication.
Resource planning
Assigning resources across a multi-team project with availability constraints, differentiated costs by profile, and dependencies between deliverables — that’s an optimization problem. Excel, with its built-in Solver, can handle it. Your SaaS tool will give you a Gantt chart.
Custom reporting
My attention to detail reveals something many people overlook: the value of a report lies in its relevance to its specific audience, not in its conformity to a standard template. Excel lets you build bespoke reports with exactly the metrics your client or management wants to see — nothing more, nothing less.
Turning a template into a laboratory: the concrete method
Starting from an Excel template is a good move. Turning it into a custom analytical tool is where the real work begins.
After analyzing dozens of project management workflows in professional environments, here is the progression that actually makes a difference.
Step 1: Audit the available data. Before opening any template, exhaustively list the data your project produces — time spent, costs, deliverables, client feedback, incidents. These are your raw materials.
Step 2: Identify the priority analytical questions. What decisions do you need to make each week? What indicators would help you make them faster and more accurately? These are your target KPIs.
Step 3: Choose the template as your base structure. Among the 54 available templates, select the one whose data structure is closest to your needs. You don’t have to start from scratch — you adapt.
Step 4: Build the analytical layers. This is where Excel reveals its true nature. Pivot tables, conditional formulas, dynamic charts linked to named ranges, data validation to ensure input integrity — each layer increases the analytical power of the model.
Step 5: Automate updates. VBA macros or Power Query let you automate data imports from other sources — CRM exports, time tracking files, financial data. Your “laboratory” updates itself without manual intervention.
The use cases where Excel crushes the alternatives
Let’s be direct. There are specific contexts where Excel isn’t “just as good” as the alternatives — it is objectively superior.
Construction and engineering projects: quantity takeoffs, bill of materials, earned value management (EVM) analyses require calculations that only a spreadsheet can handle with the required flexibility. Specialized software costs thousands of euros per year. Excel is already there.
Consulting and strategic studies: every engagement is different. Reporting models must adapt to the sector, the client, the specific metrics of the project. No SaaS can offer this level of customization without custom development.
R&D and scientific projects: experimental data analysis, trend curves, statistical tests — Excel with its analysis add-ins is a full-fledged research tool for teams that don’t have access to expensive specialized software.
SMB project portfolio management: a digital agency managing 20 clients with different budgets, hours, and deliverables doesn’t need an ERP. It needs a well-built Excel model that consolidates everything at a glance.
But watch out for the trap: Excel is not a real-time collaboration solution. For distributed teams that need to work simultaneously on the same data, the limitations are real. It’s an analytical construction tool, not a team communication tool.
What this reveals about our relationship with tools
Here’s where it gets deeper than a simple tool comparison.
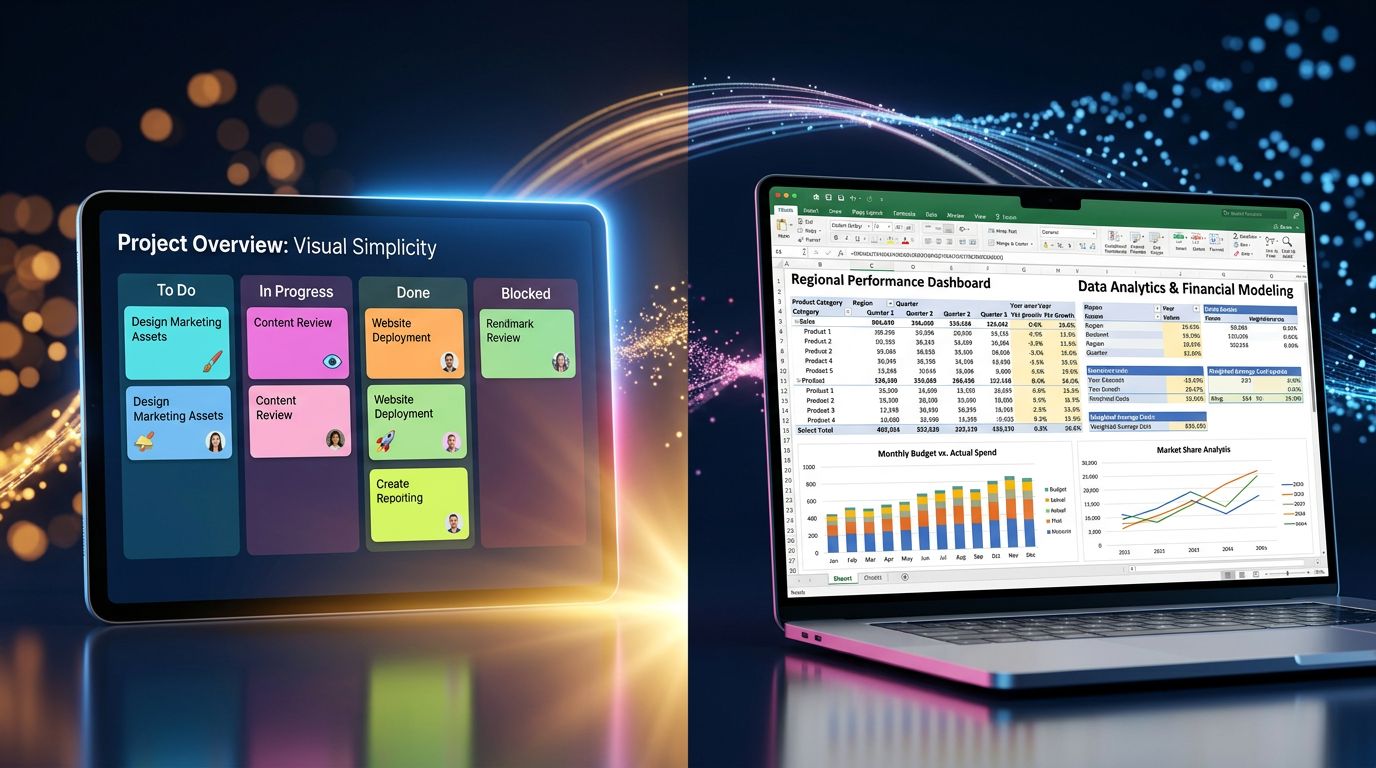
The enthusiasm for new project management platforms reveals an underlying trend: we prefer the appearance of organization over its substance. A colorful Kanban board gives the impression of control. A well-built Excel financial model actually delivers it.
Gartner’s research on project management tools consistently shows that the actual adoption rate of advanced features in SaaS platforms rarely exceeds 30%. Teams use the basic views, task lists, and due dates. The rest is noise.
Excel enforces a different discipline. You can’t have a feature you haven’t built. Every formula, every table, every chart is intentional. It’s a tool that resists superficiality.
“Unmanaged complexity in a sophisticated tool is less useful than perfect mastery of a basic one.” — A principle I apply systematically when auditing tool stacks.
Three actionable insights to get started now
1. Audit your next project before choosing your tool. List the analytical decisions you’ll need to make. If they require complex calculations or custom reports, Excel is probably your best starting point.
2. Treat the free templates as skeletons, not solutions. The template gives you the data structure and base formulas. Your added value is the analytical layer you build on top — the indicators specific to your context.
3. Combine, don’t choose. Excel for deep analysis. A collaboration tool for team communication. The best professional workflows are not monolithic — they use each tool for what it does best.
The real question isn’t about the tool
If I were your operational strategist, here’s what I’d tell you: stop looking for the perfect tool and start building the analytical model you actually need.
Excel with its 54 free templates isn’t a turnkey solution. It’s an invitation to build something precisely adapted to your projects. The difference between a team that manages its projects and a team that truly understands them — it often comes down to the quality of its analytical infrastructure.
Tools that think for you have one limit: they think like everyone else. Excel thinks like you.
For freelancers and agencies who want to go beyond simple project management — who want an assistant that knows their clients, remembers their context, and works even while they sleep — that’s exactly the territory Nova-Mind explores. Not to replace your analytical rigor. To amplify it.
Build your laboratory. Your project data deserves better than a Kanban board.
Share this article
Social networks
Analyze with AI

Charles Annoni
Front-End Developer and TrainerCharles Annoni has been helping companies with their web development since 2008. He is also a trainer in higher education.