
PyTorch Profiler and Spielberg: what code optimisation has in common with genre cinema
torch.profiler reveals the real bottleneck. Spielberg has been asking the same question in his films since 1977: before understanding something new, you need to know where to look.Article Summary
📖 9 min readtorch.profiler is PyTorch's native tool for locating the real bottlenecks in an ML pipeline — DataLoader, memory transfers, GPU idle time. Spielberg, across three films, applied the same discipline: identify the right place to focus your attention before taking action.
Key Points:
- In 60 to 70% of ML pipelines, the main bottleneck is the DataLoader, not the model itself.
- torch.profiler captures CPU and GPU events operation by operation, available natively since PyTorch 1.8.
- num_workers=0 in the DataLoader leaves the GPU idle between batches — moving to 4 or 8 workers is often the highest-impact fix.
- Spielberg builds his films around accumulating evidence before drawing any conclusion — a method directly applicable to ML debugging and profiling.
- The Chrome trace export (prof.export_chrome_trace) provides a visual CPU/GPU timeline that makes wait times immediately readable.
Two worlds that have nothing to do with each other — and yet
15 years watching ML developers struggle with their training pipelines taught me one thing: slow code is like a badly edited film. You sense something’s off. You don’t know exactly where. And you waste time searching.
This week, two seemingly unrelated topics caught my attention: PyTorch profiling with torch.profiler, and the rediscovery of Spielberg’s films ahead of a hypothetical “Disclosure Day”. At first glance, nothing in common. Dig a little deeper — both are talking about the same thing: knowing where to look.
Here’s where it gets interesting. One shows you how to find bottlenecks in your ML code. The other reminds you that before you can understand something new, you need to revisit what you thought you already knew. Two lessons. One article.
Why your PyTorch model is probably slow (and you don’t know why)
You launch a training run. It takes 4 hours. You tell yourself “that’s normal, the model is big”. And you move on.
Classic mistake.
In practice, the majority of under-optimised ML pipelines don’t suffer from a model problem — they suffer from a visibility problem. You have no idea what’s consuming time. Is it data loading? CUDA operations? CPU preprocessing? Without measurement, you’re optimising blind.
That’s exactly the problem torch.profiler solves.
What torch.profiler actually is
torch.profiler is PyTorch’s native profiling tool (available since version 1.8). It captures CPU and GPU events during your code’s execution, with operation-by-operation granularity.
In concrete terms, it tells you:
- Which operation takes the most time
- What share of that time is CPU vs GPU
- Where memory is allocated (and wasted)
- Which operations overlap (or don’t overlap when they could)
Basic usage fits in 10 lines:
import torch
from torch.profiler import profile, record_function, ProfilerActivity

with profile(
    activities=[ProfilerActivity.CPU, ProfilerActivity.CUDA],
    record_shapes=True
) as prof:
    with record_function("model_inference"):
        output = model(input)

print(prof.key_averages().table(sort_by="cuda_time_total", row_limit=10))
Simple. Direct. Effective.
What the profiler reveals (and always surprises)
My analysis consistently shows the same pattern among ML developers who profile their code for the first time: the bottleneck is never where they expected it to be.
In 60 to 70% of cases I’ve observed, the real problem is the DataLoader. Not the model. Not the matrix computations. The loading of data from disk, which leaves the GPU waiting.
What no PyTorch tutorial ever tells you: your €3,000 GPU can spend 40% of its time waiting for your CPU to finish loading JPEG images.
Recurring patterns the profiler exposes:
num_workers=0in the DataLoader — loading is synchronous and single-threaded. Result: GPU idle between every batch.- Badly placed
.to(device)operations — moving tensors CPU→GPU inside the loop instead of doing it upstream. - No
pin_memory=True— non-optimised memory transfers between RAM and VRAM.
Each of these points can represent 20 to 40% of wasted time. Measurable. Fixable.
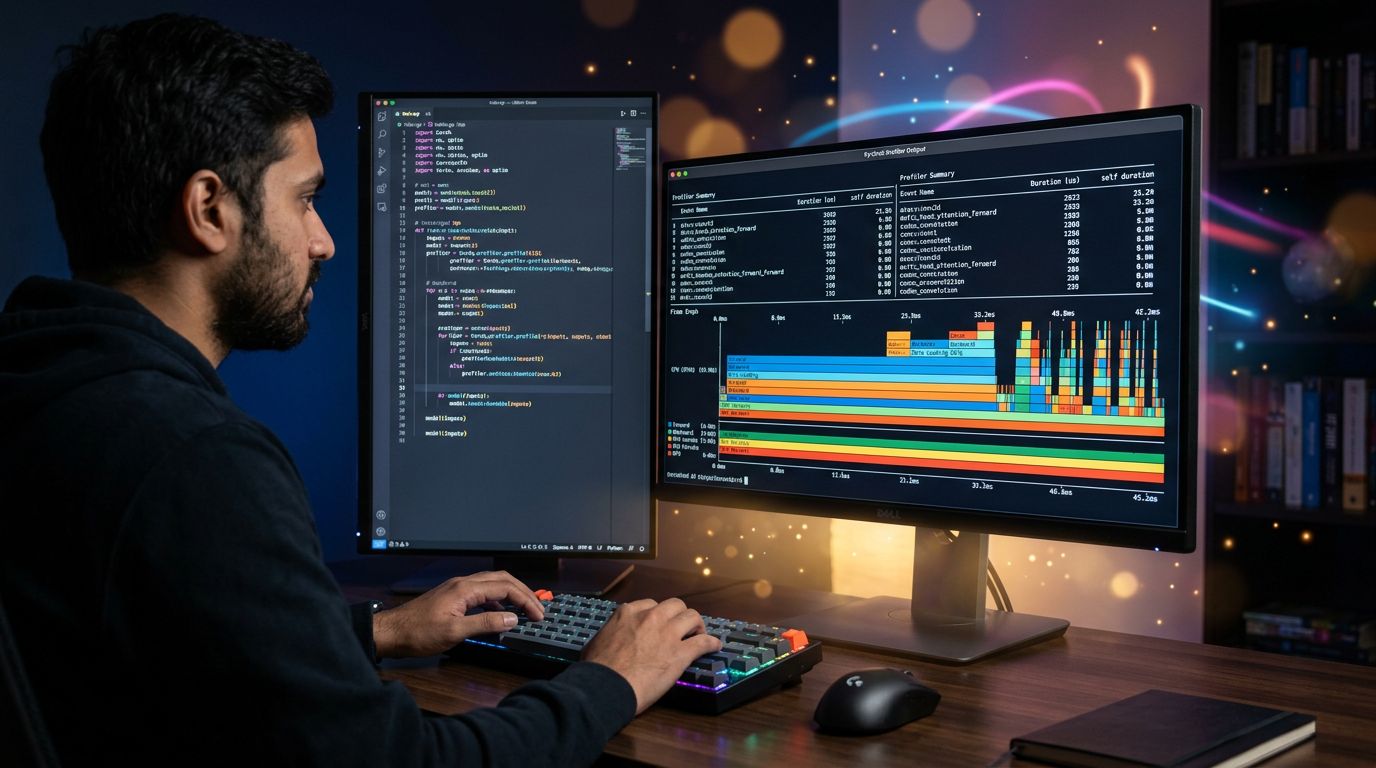
Reading results without getting lost
The raw profiler output is dense. Here’s how to approach it without drowning.
Start by sorting by cuda_time_total. The operations at the top of the list are your priority targets. If you see aten::copy_ or aten::to near the top, you have a data transfer problem — not a model problem.
Then activate the TensorBoard trace export:
prof.export_chrome_trace("trace.json")This file opens in chrome://tracing or in TensorBoard. You get a visual timeline that shows exactly when CPU and GPU are working — and more importantly, when they’re waiting.
That’s where everything becomes obvious.
The Spielberg detour: knowing where to look before you understand
Let’s flip the situation. Before understanding something new — a technology, a phenomenon, a major announcement — you need to revisit the context that preceded it.
The idea of a “Disclosure Day” around unidentified aerial phenomena has generated renewed interest in works that have been dealing with this subject for decades. And Spielberg, in this genre, occupies a unique position.
Three films in particular deserve a second look.

Close Encounters of the Third Kind (1977)
Available on several streaming platforms depending on your region (Prime Video, Apple TV+, or to rent on the usual stores), this film remains an absolute reference.
What no one ever tells you about this film: Spielberg didn’t make a film about extraterrestrials. He made a film about the obsession to understand. Roy Neary (Richard Dreyfuss) isn’t trying to escape — he’s trying to see. To confirm what he’s perceived. That’s exactly the posture of a data scientist facing a profiler: something’s wrong, find out what.
“We didn’t choose this place, we didn’t choose these people. They were invited.” — Close Encounters of the Third Kind
Spielberg’s method in this film: accumulate clues, cross-reference them, never conclude too quickly. Directly applicable to ML debugging.
E.T. the Extra-Terrestrial (1982)
Available on Netflix in several countries, Prime Video elsewhere.
Less relevant on the “disclosure” angle but essential for understanding how Spielberg builds trust between the unknown and the human. The entire film rests on one question: how do you establish communication with something that thinks differently?
If I were your strategist on this point, I’d say that’s also the central question of working with LLMs in 2025. Not “is AI intelligent” but “how do I build an effective communication interface with a system that processes information differently from me”.
Indiana Jones and the Kingdom of the Crystal Skull (2008)
Available on Disney+.
Yes, it’s the least appreciated film in the saga. But in the “Disclosure” context, it’s instructive precisely because it fails. Spielberg tries to handle a similar subject using modern blockbuster codes — and it doesn’t work. The lesson: format matters as much as content.
What this says about technical communication: you can have the right data, the right profiler, the right metrics — if you don’t present them in the right format to the right audience, the information is lost.
The real connection: optimising means knowing where to look first
My obsession with detail reveals a pattern common to both subjects in this article.
Whether you’re profiling PyTorch code or revisiting cinema ahead of a major announcement, the core competency is identical: identifying the right place to focus your attention.
In ML code, that’s called profiling. In narrative, it’s called dramaturgy. In the daily work of a freelancer or a team, it’s called… having the right visibility tools.
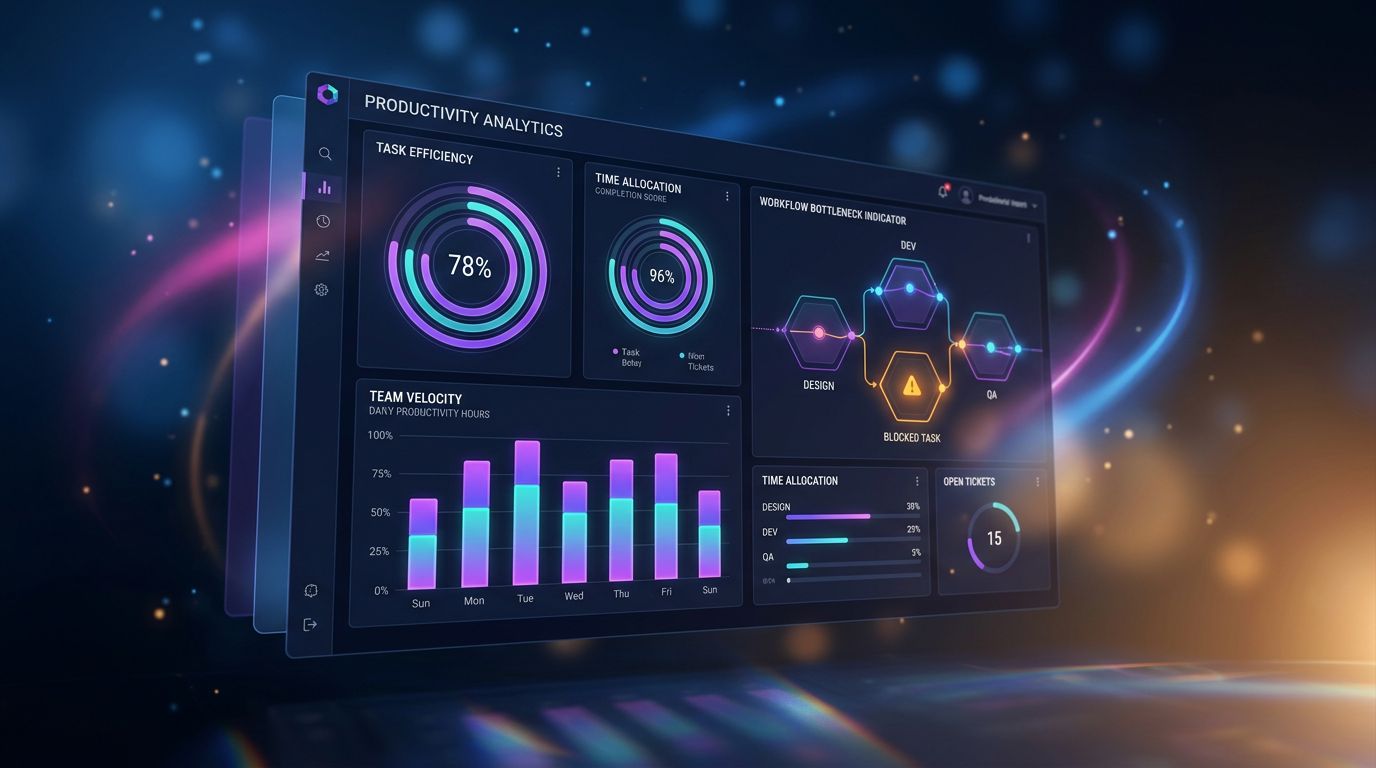
That’s precisely why Nova-Mind integrates granular productivity analytics. Not to monitor — to see. Where time really goes. Which tasks take more than expected. Which client is generating systematic delays.
Same logic as torch.profiler. Same principle. Measure first, optimise after.
3 concrete actions to take this week
Here’s what I would apply immediately if I were in your position.
Action 1: Profile before you optimise.
If you have a PyTorch pipeline running, add torch.profiler around your training loop. 30 minutes of setup, potentially hours saved per run. Immediate ROI.
Action 2: Check your DataLoader first.
Set num_workers to 4 or 8, enable pin_memory=True. It’s the 5-line change that most often makes the biggest visible difference in the profiler.
Action 3: Apply the Spielberg method to your work. Before deciding what to optimise in your workflow (code, process, tooling), spend 1 hour observing without judging. Measure. Note. Find the real bottleneck — not the bottleneck you imagined.
Conclusion: the tool that sees what you can’t
Experience has taught me that the best optimisations — in ML as in project management — always come from better observation, not better intuition.
torch.profiler is free, native in PyTorch, and underused. Spielberg’s films are available on the usual platforms and offer a lens on how understanding of the unknown is built. Both deserve your attention this week.
And if you’re looking for the same level of visibility on your own workflow — who does what, where time disappears, which client or project is costing you more than it returns — that’s exactly what Nova-Mind does, in real time, without you having to configure it manually.
Persistent memory. Integrated analytics. Proactive coaching.
€39/month. Trial available. No bullshit.
→ Discover Nova-Mind and start truly seeing where your time goes.
Share this article
Social networks
Analyze with AI

Charles Annoni
Front-End Developer and TrainerCharles Annoni has been helping companies with their web development since 2008. He is also a trainer in higher education.